Progress Dashboards
One of the goals of myTIPreport is to make it easy to quickly understand how a learner is doing. To enable doing this with ease, we built Progress Dashboards. A learner can view his or her Progress Dashboard by clicking on Progress Dashboard in the navigation menu. An administrator can view the dashboards for each of his or her learners by click on Reports in the navigation menu, followed by Student / Resident / Fellow Dashboards and then choosing a learner. Currently these are only viewable on the website.
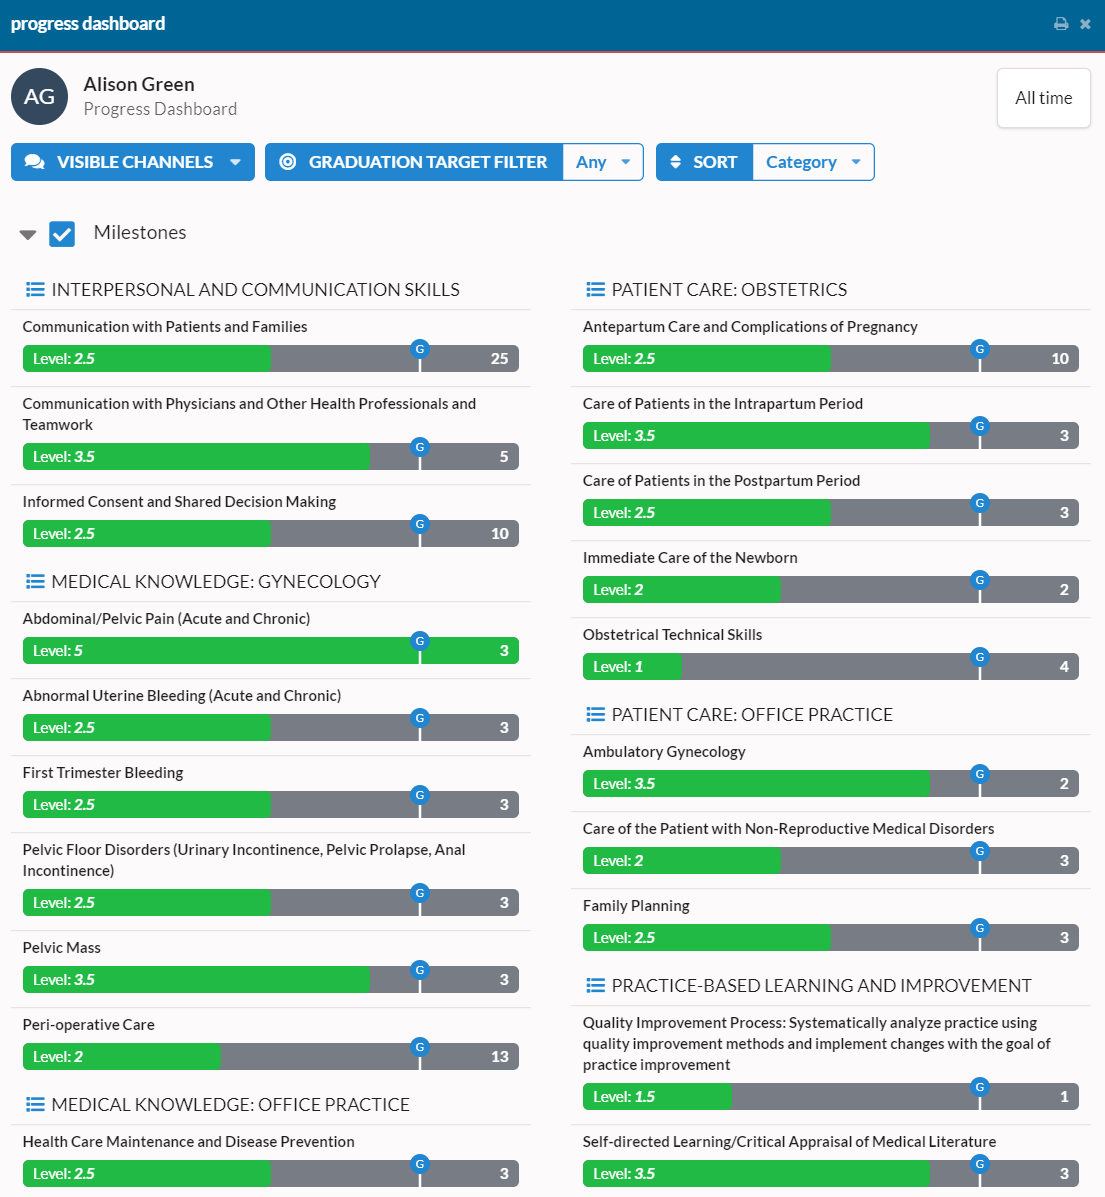
Dashboards give an overview of all of the areas a learner is tracking progress in:

Each entry represents a specific evaluation form. The entry contains the name of the form (e.g. the name of the procedure or milestone). The green bar shows their achieved progress thus far and the pin shows their graduation target (for a full discussion of graduation targets, including changing them, see our help topic here). The text on the left shows their current level and the text on the right shows the number of interactions they've had.
Filtering and Sorting
There are a number of different options for filtering and sorting so that you can view the data in a way that answers the questions that you have. You'll find the sorting options at the top of the view.
Show or Hide Channels
The first entry in the toolbar allows you to control which channels are shown. Click on VISIBLE CHANNELS to control which channels are displayed.
Filter based on Graduation Target
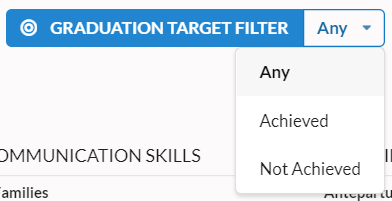
At the top of the view, there is a filter dropdown with the following options:

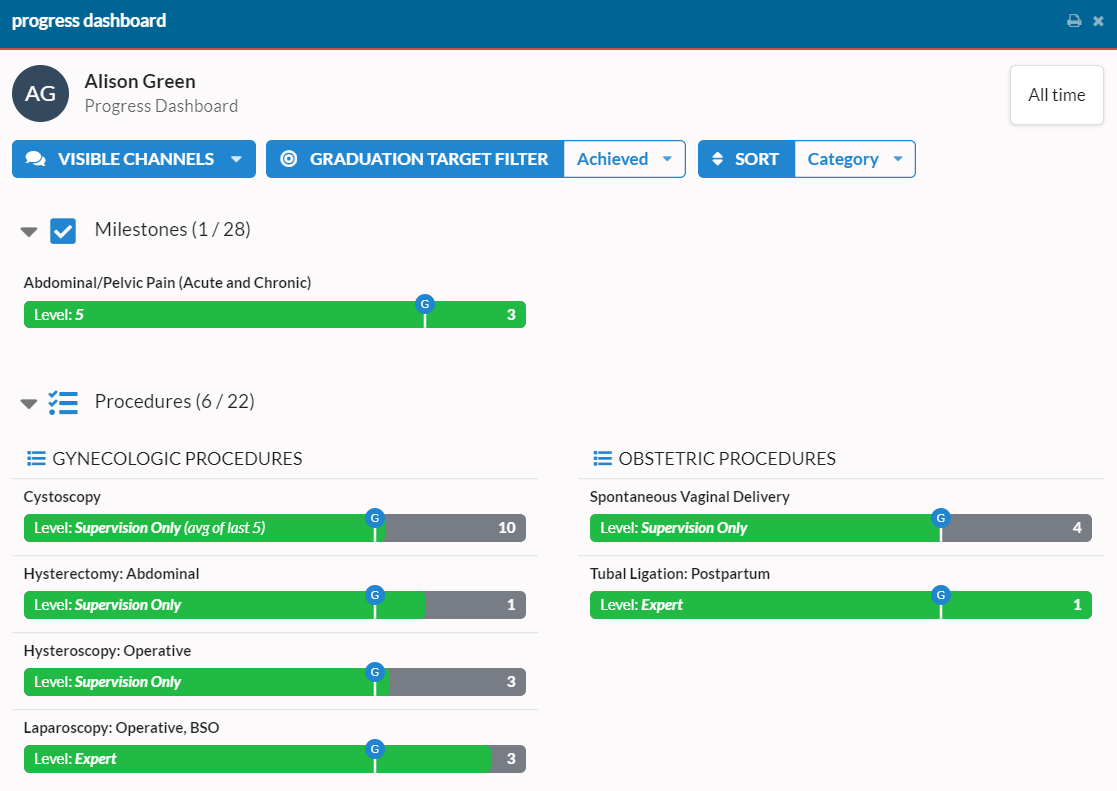
It defaults to Any (which shows all areas, regardless of whether the learner is meeting the target or not). Select Achieved to see all of the places they are meeting the graduation target or Not Achieved to see the opposite.

When a filter is applied, the following things also happen:
- Each section shows a status count of how many of the forms in that section meet the current filter.
- Any item that doesn't have a graduation target is excluded from the view and the overall count, regardless of progress.
Sorting
Here is an explanation of the various sorting options:
- Content
- Category: The default view. Groups competencies by category and shows in a condensed view.
- Name: Orders competencies by their name.
- Progress
- Most to Least: Orders competencies based on their total progress, with those with most progress at the top.
- Least to Most: Orders competencies based on their total progress, with those with least progress at the top.
- Progress Relative to Graduation Target
- Most to Least: Orders competencies based on their progress relative to the graduation target, with those with most progress at the top.
- Least to Most: Orders competencies based on their progress relative to the graduation target, with those with least progress at the top.
If you have any feedback on the Progress Dashboard, we'd love to hear it! You can reach us at [email protected].