Participation Reports
One of the goals of myTIPreport is to increase participation in the feedback process for both learners and teachers. A key to increasing participation is monitoring who is and isn't participating. Fortunately, myTIPreport has reports available that allow you to breakdown who is participating and what areas they are participating in.
Activity Report
To view participation activity reports for both learners and teachers, login to the web as an admin and click on reports. Under both Faculty and Residents, you'll see entries for Activity. Click either to view the report.
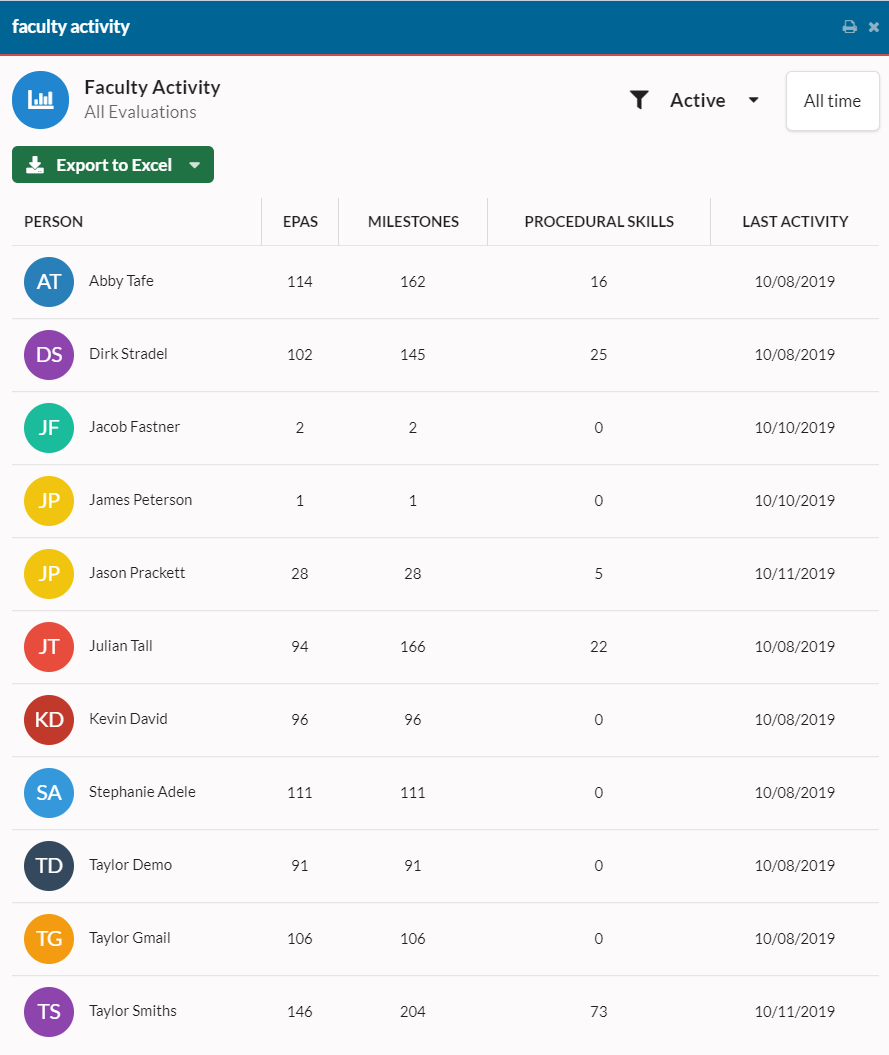
In this view, for each user you'll see the number of evaluations they've submitted for each evaluation type in the given time period. The time period control is located in the top-right-hand corner and by clicking on it you can change the time period for which data is shown.
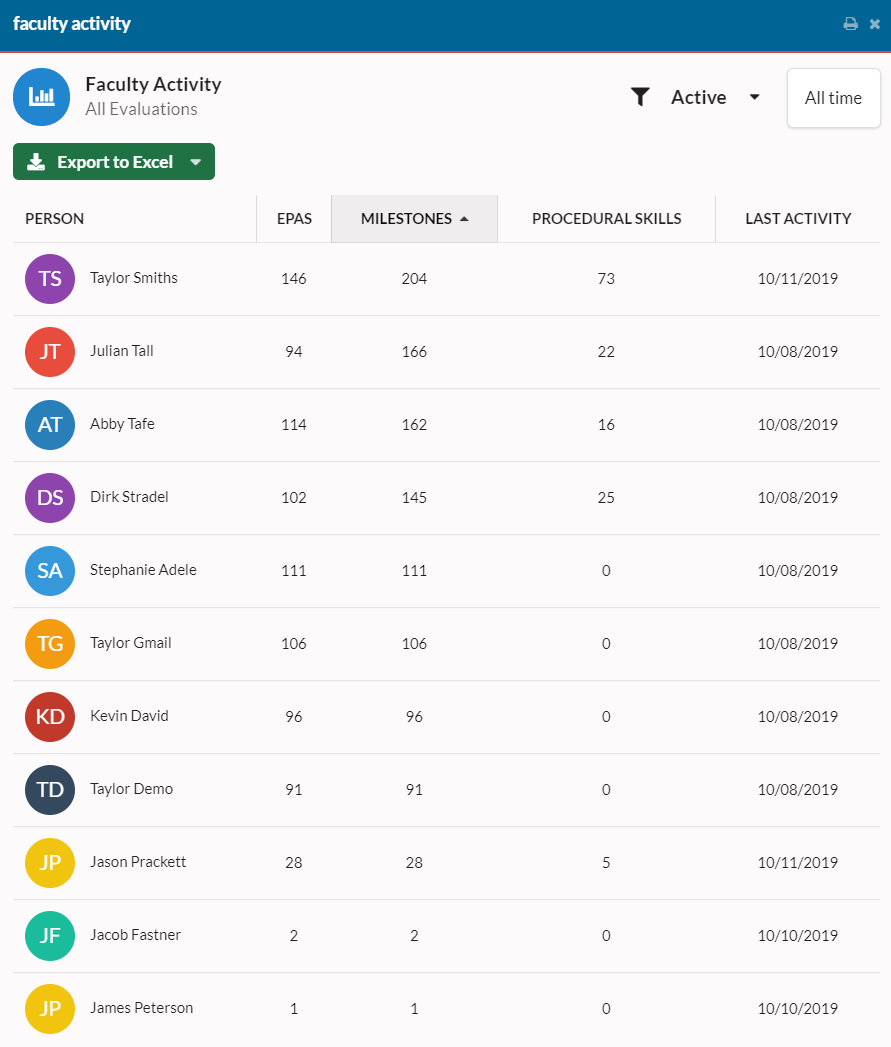
To see who has been participating the most in a given area, you can click the column headers to sort. For instance, clicking on MILESTONES above will reorder the results as follows:
Drilling In
Each individual cell in the table is clickable and will show you the evaluations that contribute to those cells. For faculty members, this will show summary views that show the average rating given by the faculty member for each competency along with the number of evaluations they've given on that competency.
If you'd like to generate custom reports on the activity (or other evaluation data), all data can be exported to Excel using the green Export to Excel button at the top of the page.
If there are more features that would be useful when it comes to tracking participation, don't hesitate to reach out to us at [email protected] and let us know!