Competency Dashboards
One of the goals of myTIPreport is to make it easy to visualize the data you've gathered. We've found that its common for a program to want to understand how all of it's learners are doing on a given milestone, procedure or EPA. To help with this, we built Competency Dashboards. An administrator can view the Competency Dashboards for their program by clicking on Reports in the navigation menu, followed by Competency Dashboards and choosing a competency.
This will show a view of how your learners are doing in the competency that you've chosen:
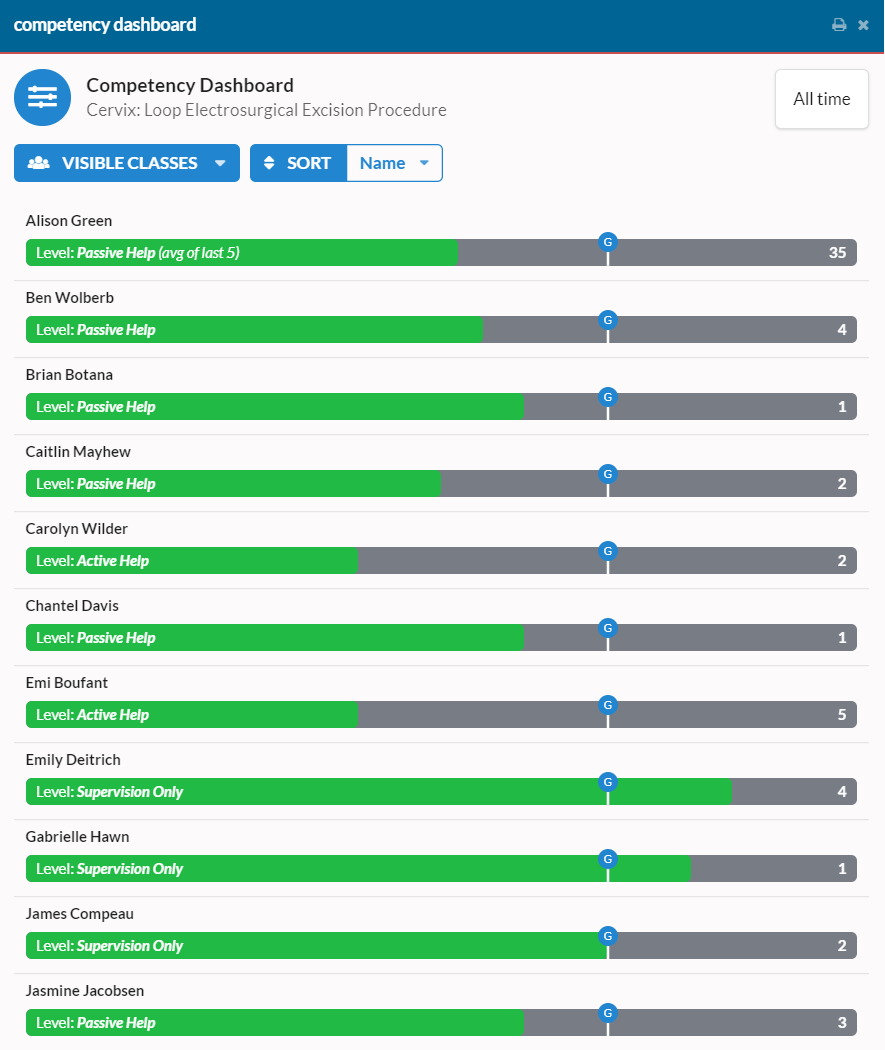
Each entry represents a learner in your program. The green bar shows that user's achieved progress thus far and the pin shows their graduation target (for a full discussion of graduation targets, including changing them, see our help topic here). The text on the left shows their current level and the text on the right shows the number of interactions they've had.
Filtering and Sorting
There are a number of different options for filtering and sorting so that you can view the data in a way that answers the questions that you have. You'll find the sorting options at the top of the view.
Show or Hide Classes
The first entry in the toolbar allows you to control which classes of learners are shown. Click on VISIBLE CLASSES to control which classes are displayed.
Sorting
By default, the entries are sorted by the learner's name. The other options allow you to sort by progress, with either those with the most progress or the least progress appearing at the top.
If you have any feedback on the Competency Dashboard, we'd love to hear it! You can reach us at [email protected].