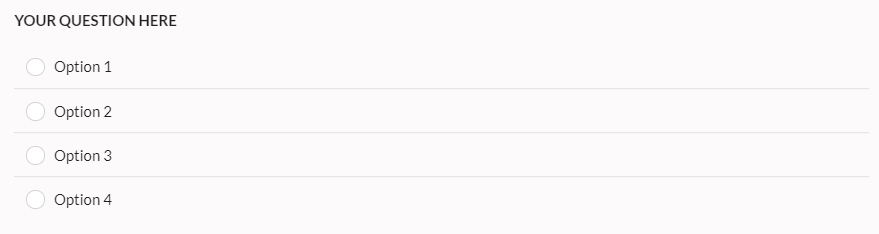
Multiple Choice
Best used for selecting a single item from a list of options
Data Visualization
This question type allows the type of data that is displayed on Summary and Insights views to be customized. To configure how this data is visualized, click over to the advanced tab.
Click the Data Visualizations dropdown to see the different visualization options.
Visualize Chosen Value Distribution
This option allows you to visualize the relative response rate for each of the options.
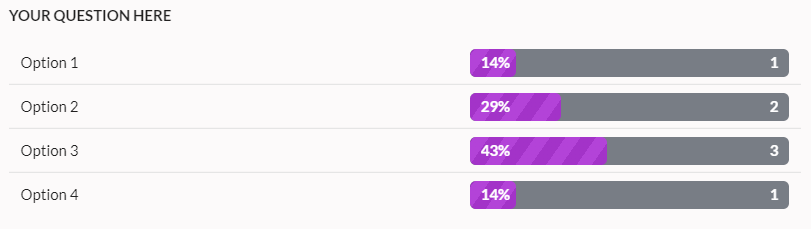
This display currently only shows on the Insights page.
Visualize Average Value Chosen
This option allows you to visualize the average of the responses that have been received.

Averages are calculated by assuming that the options are ordered from least / worse to most / best. Internally the first option is given the value of 1, the second option is given the value of 2, and so on. Those numerical values are used when calculating the average.