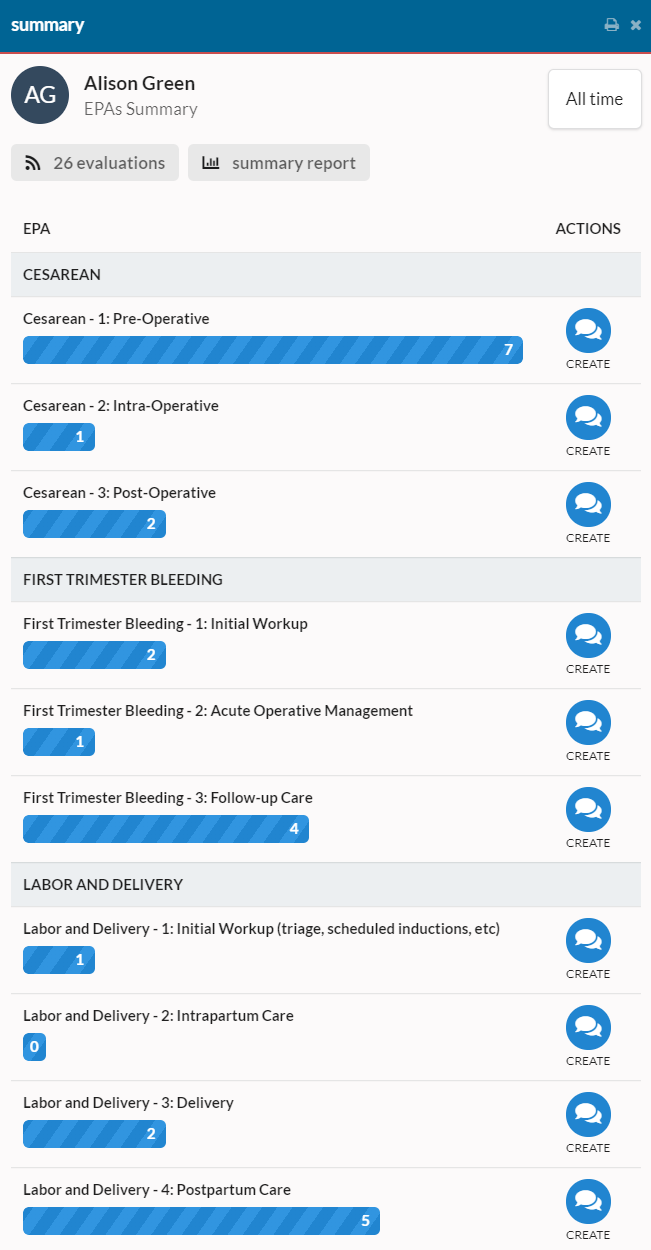
myTIPreport will now automatically show a graphical visualization of evaluation counts. Before this, evaluation counts would only show as text values. Now they’ll show as graph bars that will size relative to each other:
We’ve also made a small improvement to our admin experience that will reduce the number of clicks when configuring myTIPreport. When letting you know that changes that you’ve made were successfully saved, we’ll now show the success message in a toast that will automatically dismiss itself instead of a modal dialog box that required a click:
User experience is incredibly important to us. If you have ideas for improving it further on the web or in the phone app, please reach out to us at support@mytipreport.org.